-
The Memory Paradigm
Background
First some background: I have been positive on both Micron and Western Digital for several months now. This general positive sentiment was highlighted through the following LinkedInPost in August.
Well, this played out mostly as I expected. Micron is up close to 57% and Western Digital is up close to 51%. This thesis was punctuated by a run up on Dec 31st seemingly related to some source unverified news out of Samsung that DRAM Capex will mostly be unchanged and there will be an increase NAND Capex in CY 21. WDC rallied 11.83% while Micron was up 4.53% on 12/31. Micron reports earnings on Jan 7th. WDC reports in early February.
I generally like picking up both of these when the sentiment on the street is a little muted. Will have to wait til the earnings reports come out but would temper the enthusiasm, especially on Western till we know more. In the interim, here are some considerations and information that I hope you find useful in terms of assessing the memory industry and how things could shape up for the major players
Understanding the Memory Hierarchy
With the background out of the way, what I would anchor this post to is a general understanding of the memory hierarchy. To increase the odds of investing success in this sub sector, it pays to understand the technology at a non superficial level. If not, there will be an unhealthy dependence on Wall Street consensus and you may end up being late to good investment opportunities.At a very basic level, the diagram below often referred to as the Memory Hierarchy diagram, succinctly provides the different memory technologies and their specific attributes ( cost, speed, capacity).
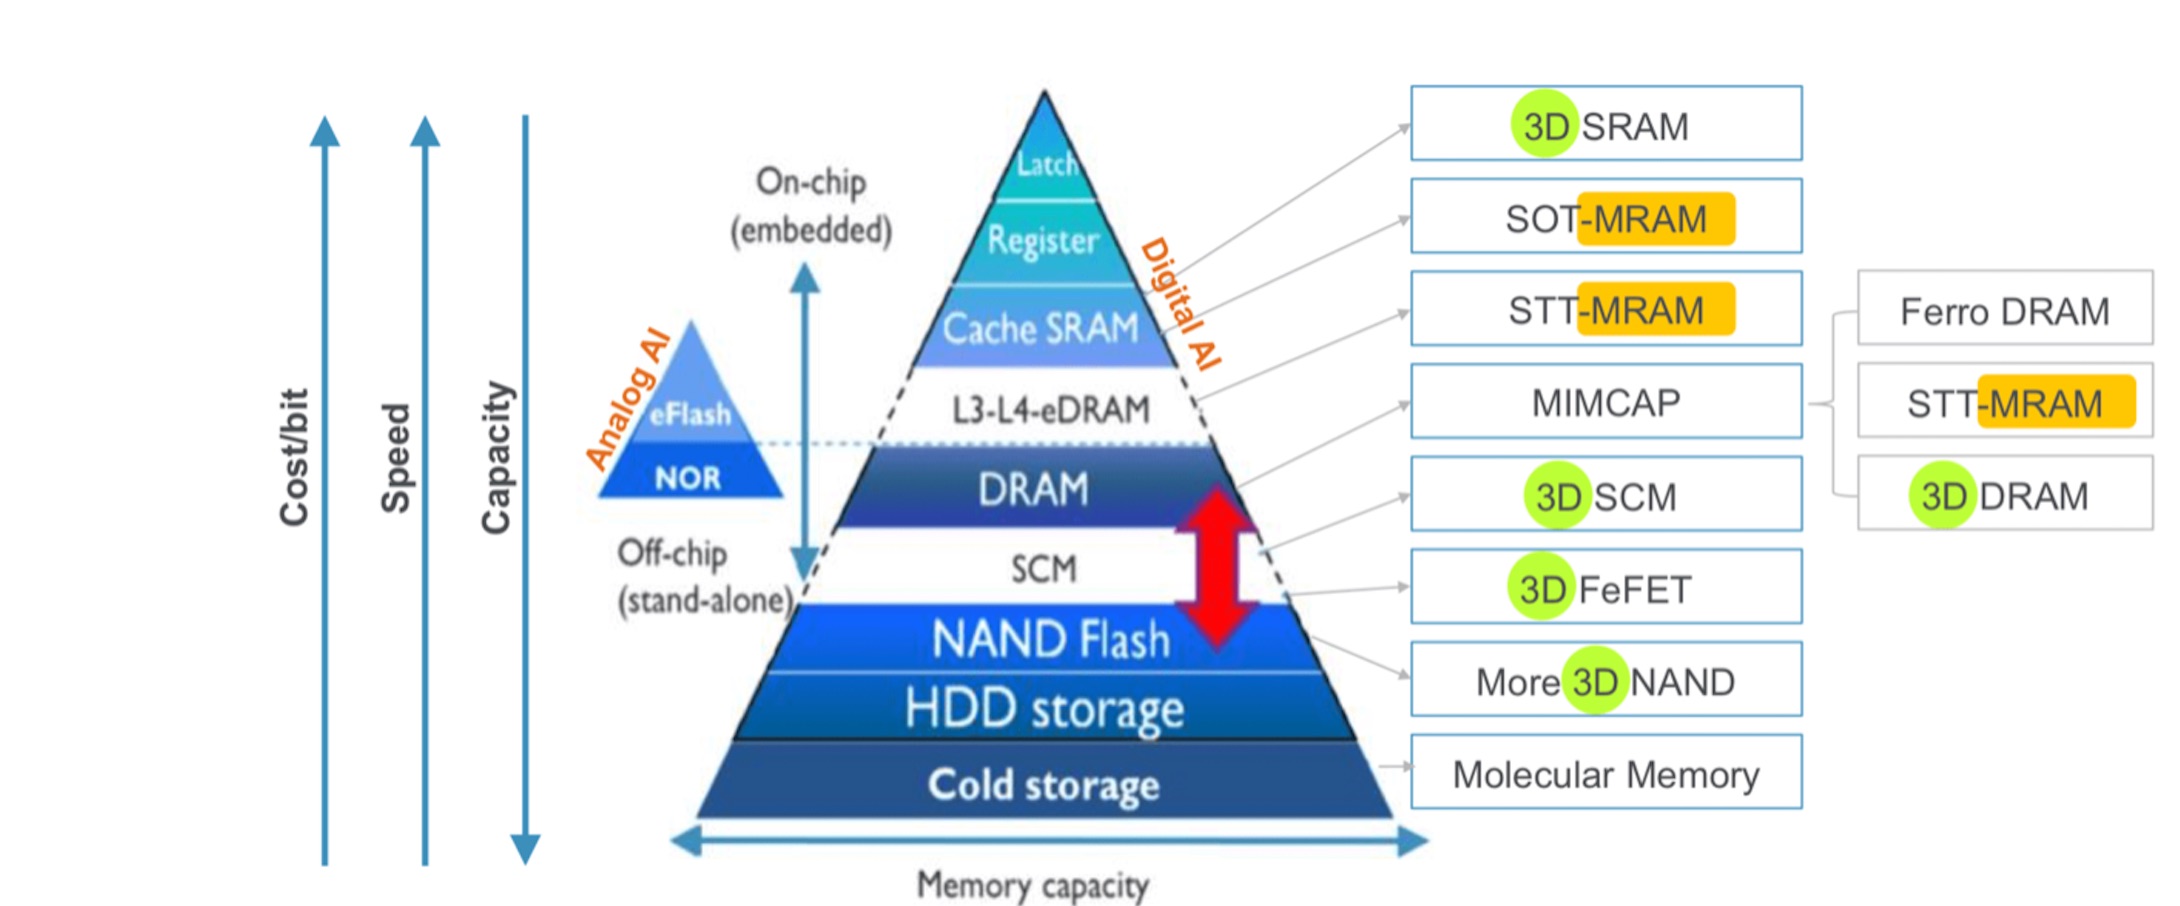
Source: IMEC
SRAM (Static Random Access Memory)is on-chip memory meaning it is integrated into the processor. This is a volatile memory that uses a transistor and latch method (generally 6 transistors) to store bits and not capacitors. SRAM loses information when turned off but is faster than DRAM because there is no need for a refresh cycle ( due to the latching mechanism) or a write back for data retention. It is more expensive than DRAM due to the larger transistor footprint. There are some variants of SRAM like non-volatile SRAM and pseudo SRAM. SRAM finds itself a perfect use case as the on chip caching mechanism and a possible digital to analog converter on video cards. They key vendors are Cypress Semi Conductors ( now part of Infineon Technologies), Renesas and Samsung.
DRAM (Dynamic Random Access Memory) is located adjacent to the CPU in the memory module and constitutes the “main memory”. DRAM is capacitor based volatile memory and is cheaper than the SRAM. Performance is not as good as SRAM due to the need for constant refresh cycles and write back operations. DRAM generally holds the program code that is about to executed so that there is lesser need for “travel” to and from the CPU. There are different types of DRAMs like SDRAM, DDR2, DDR3, DDR4, DDR SDRAM and ECC DRAM.
Flash memory is a key underpinning of present day consumer technology ( finding use in smartphones, ) and is a non volatile type of memory. It is based on a floating gate single transistor technology. The bits are stored and retained by a “trapping” mechanism whereby the electrons are force held in the floating gate. Flash is fast and cheap but mainstream flash is not enduring and can be physically destructive across several cycles. Flash usually exists in two forms NOR Flash and NAND flash with the latter being the more prominent. NOR takes longer to write/access and usually serves as read only memory and embedded memory use cases. NAND, on the other hand provides more dense storage and faster write/access. NAND usually provides only block level ( and not byte level) access like NORs. With these characteristics, NAND is used in flash memory cards and solid state drives(SSD’s). Even within the NAND family, there are various classifications as is described below from the Micron product site.
NAND flash devices, available in 128Mb to 2Tb densities, are used to store data and code. Low-density NAND flash is ideal for applications like STBs, digital televisions (DTVs), and DSCs while high-density NAND flash is most commonly used in data-heavy applications like SSDs, tablets, and USB drives. There is a continuous effort to reduce the cost/GB of NAND devices, so device life cycles tend to be shorter with more frequent process lithography shrinks. NAND requires a controller, either internal or external, and specific firmware for error code correction (ECC), bad block management, and wear leveling.
There are two primary types of NAND: raw and managed. Raw NAND comes in different flavors, including single-level cell (SLC), multilevel cell (MLC), triple-level cell (TLC) and quad-level cell (QLC). Raw NAND requires external management but is the lowest cost/GB NAND flash available. Managed NAND incorporates memory management into the package, simplifying the design-in process.
Market Dynamics and Opportunity for Micron and Western Digital
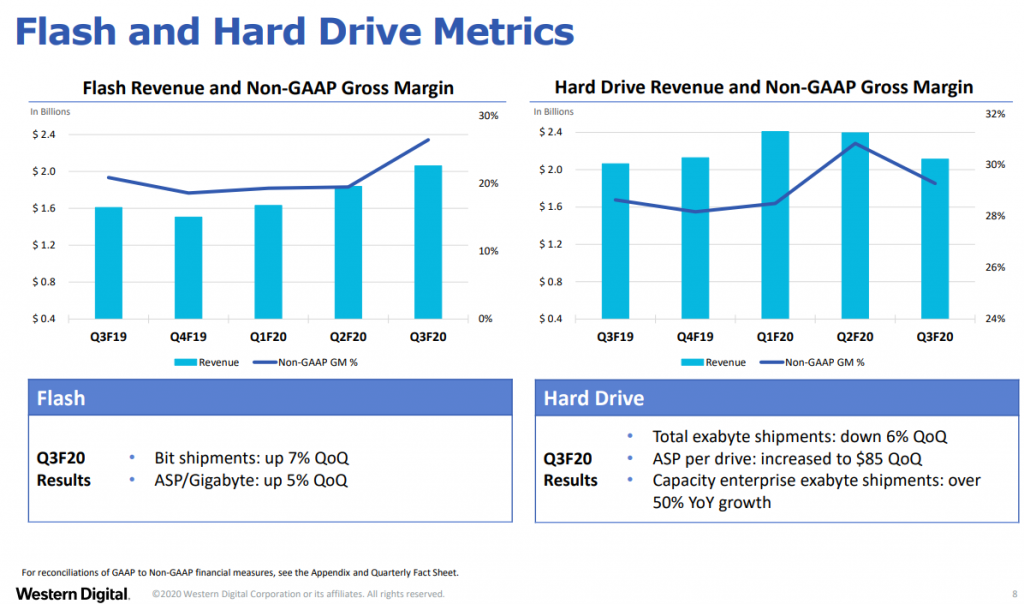
It is important to understand what the key revenue and profit drivers are for Micron and Western Digital, against the backdrop of all the underlying memory technology, use cases and competition.The most recent update from Micron was that it was upping its fourth quarter guide. As you can see from the table below – revenue, EPS and Gross Margin were all guided up. Micron saw strength across the board – in industrial, auto, PC and mobile. Enterprise continues to be weak. Both NAND and DRAM came in strong this quarter ( both volume and pricing). However, Micron did caution to not get ahead of reality on the NAND side for CY 21 owing to supply/demand dynamics.
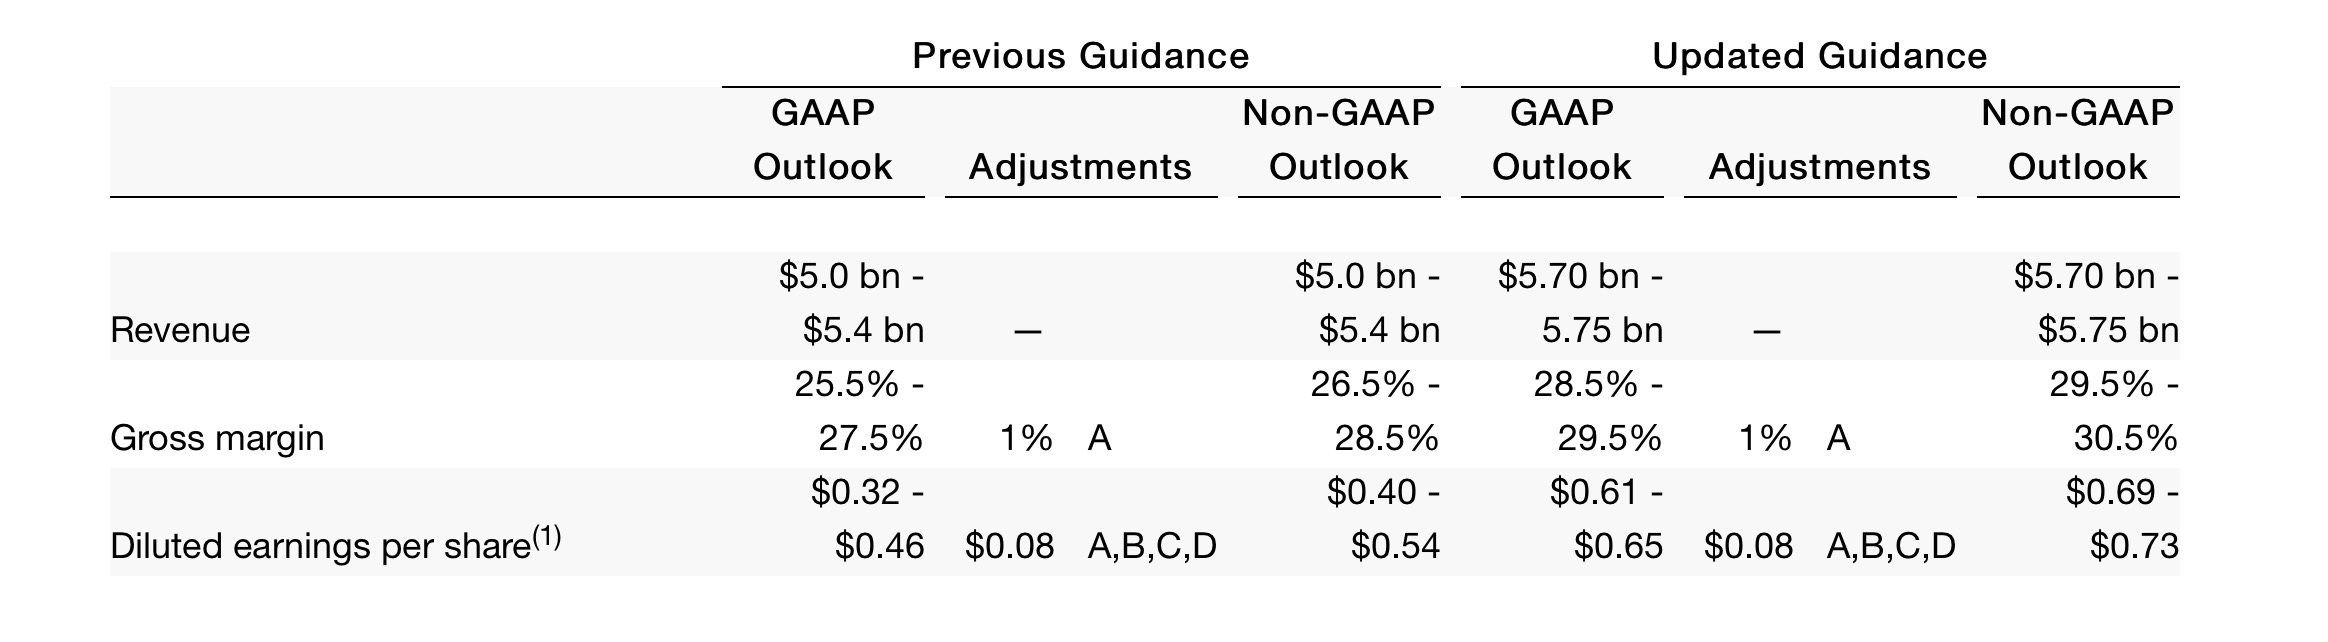
It is important to place in perspective the aspect that Micron generates more of revenue from the DRAM side ( about 60%) versus NAND. For Western Digital there is more of a dependency on the NAND side of things. Given the supply demand concerns around NAND in CY 21, the run up in Micron seems to be warranted and may have more room to run . And speaking of Western Digital, the one trend that may play out to WDC’s advantage over the next few years is the game console upgrade cycle and the need for additional storage alongside that refresh cycle. -
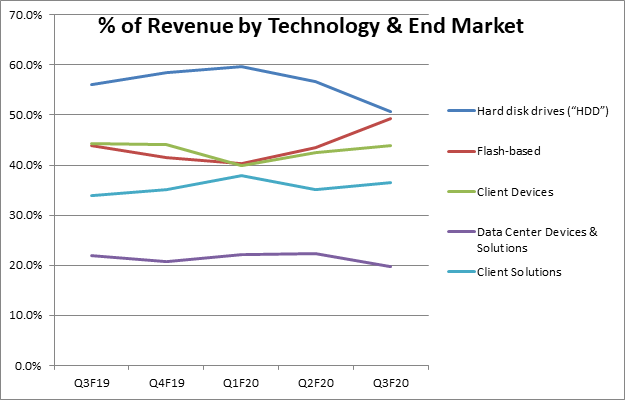
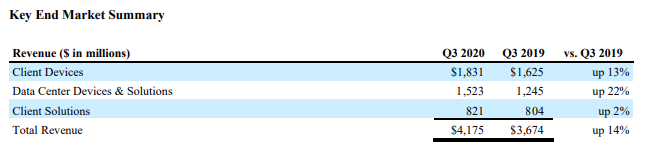
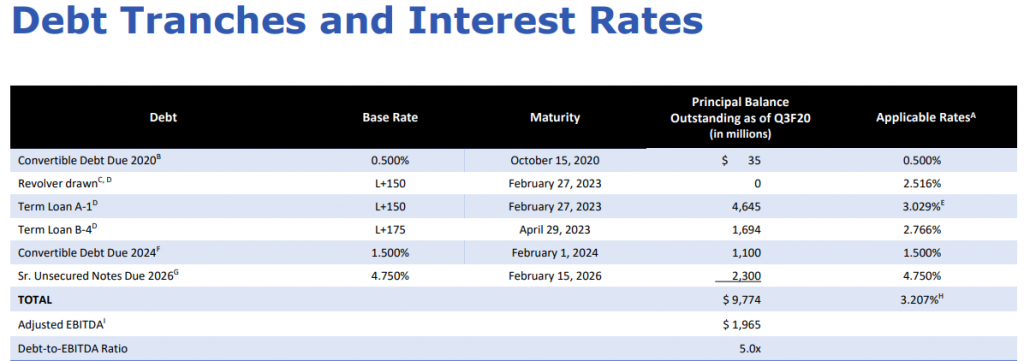
Western Digital – Key Takeaways
Some of you connected to me on LinkedIn may be familiar with a hypothetical portfolio that I am tracking from 2/21. The objective behind that hypothetical portfolio was to encourage investors to step in during the February and March time frame to start building or adding on to positions patiently and with a long term focus. Some of my friends have been ribbing me about a portfolio that has gained 35% or so when there are single stocks that move 40%+ in a week! In response, I often emphasize that this was not meant to be a get rich quick portfolio where you can expect to double or triple your money in short order. Rather, the focus was on constructing a portfolio considerate of risk-adjusted-returns, allowing you to take measured participatory risks and still increase your odds of beating the benchmark (which is the S&P 500).
One of my recent mentions was Western Digital (WDC). I suggested WDC as a possible add on 4/22 (after competitor Seagate (STX) reported earnings). My expectation was a pull-back in WDC in sympathy with STX on 4/23, which played out as I expected allowing a possible entry point in the 39$ area. The stock then surged to the mid 40’s area in the next few days along with the market. My second presumption was a possible pull back after WDC reported earnings on 4/30 mostly due to supply chain disruptions. Though the stock pulled back after earnings, what I was completely blindsided on was the suspension of the dividend. The stock pulled back 10% + the day after earnings, again allowing for a possible entry point in the $39 area. Before going into some key takeaways from the earnings, here is a synopsis of WDC and its key business segments:
Business Summary
Western Digital was founded in 1970 and operates in the data management and storage industry. In terms of the technology underpinning the storage, there is a bifurcation: rotating magnetic technology for hard disk drives (HDD’s) and semiconductor oriented flash memory (used in Solid State Drives or SSD’s). With the advent of the cloud and explosive growth in gaming, personal devices and social media data – individuals and corporates derive immense value in dense data storage. That is, more data needs to be stored and retrieved from a smaller form factor with due consideration on performance, reliability and energy efficiency. The key competitors are Seagate Technology and Toshiba in the HDD market; and Intel, Micron, Samsung and Sk Hynix in the flash market.
In terms of the reporting segments, there are 3:
1) Client Devices: Includes storage (both HDD and SDD based) for desktops, laptops, gaming consoles, security surveillance systems. The flash based devices also span smartphones, edge computing devices, wearables, Internet of Things, connected home and memory wafers/components. This segment also includes the embedded products like the multi-chip package solutions combining flash (non-volatile memory) and DRAM (volatile memory) in one package.
2) Data Center Devices and Solutions: This segment includes HDD’s and enterprise class SDD’s geared towards the fast growing data center market. Scalability of storage, performance, cost and reliability are key aspects of the solutions here.
3) Client Solutions: This segment includes HDDs and SSD’s included in removable devices (cards, USB drives and wireless drives). A lot of the increase in digital storage from a consumer perspective has a direct impact on this segment
Below are some key charts across the reporting segments and technologies.
Takeaways
Here are some key takeaways from the earnings:
- Overall Strategy: With the new CEO, what in hindsight should have been fairly apparent was a possibility of recalibration in terms of how to position the company for the future and capitalize on strengths while maintaining fiscal discipline. More specifically, given the cyclical nature of the business there seems to be absolute focus on deleveraging and cash flow.
- Net revenue of $4.2B down 1% sequentially and up 14% from the prior year period.
- The goal is to manage leverage from 1 to 3.5 times EBITDA through the business cycle with the third quarter debt to EBITDA reading closer to 5 (which btw was 5.7 earlier). Suspending the dividend gets them closer to that target ratio but management has made it clear that, as things stand, there is plenty of wiggle room to meet debt covenants. So this move should not raise any red flags there. Just for background, much of the debt on the balance sheet can be attributed to Western Digital’s $19B acquisition of SanDisk in 2015. Gross debt outstanding at the end of the third quarter was $9.8B. The goal is to get the gross debt down to $6B and net debt down to $3B.
Here are the debt tranches and Interest Rates:
- WDC management is in my opinion doing the right thing by focusing on providing visibility on a next quarter basis. These are unprecedented times and it makes sense that they are not able to provide visibility beyond the next quarter
- There is somewhat of an offsetting effect on two sides of the business. Flash and Hard Drives. Gross Margins from the flash side of the business should increase (prices trending higher but fairly volatile) while there is bound to be near term pressure in the Hard Drives side of the business. WDC would rather focus on the Enterprise SSD side of the business to channel the good demand in the data center arena.
- Public cloud is a generational technology shift and WDC wants to position itself for the enterprise hard drive market. Expect R&D spend to drive further innovation here. Similarly, on the flash side WDC wants to position to take advantage of the progress on the edge computing side and the increasing demands for more memory intensive use cases on the edge devices
- The 18TB energy assisted drive ramp is happening on ramp and there seems to be initial indication of the data center demand but this is going to really be a multi quarter story and will take time. Some indications of market share loss in the 16TB area.
- Inventory across the board seems to be at equilibrium but there may be more of a drawdown next quarter due to supply chain challenges specific to COIVD-19.
- On the technology side, WDC seems to be making good progress with the development on internal controllers and sidestepping reliance on third party vendors. There were some promising developments as highlighted in the internal product blog here: https://blog.westerndigital.com/vertical-integration-asic-platform-defines-future-products/
- In terms of the guide, Q4 revenue is expected to be in the range of $4,25B to $4.45B with non-GAAP EPS of $1 to $1.4.
Summary
- · Though we believe in prospects for WDC in the long term, the dividend suspension will now attract a different kind of investor. This may reflect in a higher beta overall on the stock and the stock maybe more susceptible to downdrafts if the overall market moves down.
- · Some of the enterprise hard drive demand story needs to be validated over the next few quarters – especially the demand side of the 18TB drive with enterprise OEM’s and hyper scale customers
- · The guide was kind of disappointing but there may be some conservatism in the numbers
- · Deleveraging is an understandable step and free cash flow discipline needs to be applauded. On the technology side, will be keen to see R&D deployed strategically to make sure that WDC keeps innovating on the areal density side
- · Watch for smartphone market improvement to see how this reflects in the flash based numbers later in the year
Our FV estimate on WDC is $54. Please contact us for the underlying FV model.
Important: This is not meant to be specific investment advice. Always check with your Financial Advisor for suitability of any investment.