-
Pairs Trading: The Math behind the Code
Over the past several years, I have experimented with different programming languages (Python, R, GNU Octave and Matlab) to implement facets of quantitative trading techniques. Personally, I have found this very fulfilling because it brings together three disciplines that interest me – finance, programming and math – in no particular order. The rubric of this process has evolved over several years and I have had to course correct and go back to the drawing board often. Since some of the actual code has been used in a commercial interest, I want to heed respect to any such obligation and refrain from using prop code in this blog. However, I have also come to realize that the code in and of itself (or the programming language) is only of secondary importance. What really matters is an appreciation of the mathematical principles underlying the trading strategy and a good disposition to risk management. My strong sense is that many of these core concepts can be applied in a health care data analysis setting; without codifying everything under the hard label of AI/ML.
The usage of different programming languages was mostly curiosity in terms of feature sets laid out in each and I have gravitated towards open source when possible. However, for this example below specific to Pairs Trading, I have used snippets of Matlab code for efficiency purposes. PS: I do wish GNU Octave had an elegant implementation of the Augmented Dickey Fuller test which I use below in Matlab.
What is Pairs Trading?
Pairs trading is a market neutral strategy (i.e. theoretically a trading strategy if constructed correctly can provide excess returns irrespective of a broader up/down/sideways market). This makes it, at least on the surface, an appealing hedge strategy. However, there is plenty of academic and market research that suggests that calls into question the efficacy of such a strategy. In my opinion the failures could be primarily due to the following reasons:
1) Picking the wrong assets to pairs trade. A cursory instinct is to pick firms that seem to be operating in the space space ( eg, (Pepsi, Coca Cola), (Intel, AMD), (Home Depot, Lowes), (Analog Devices, Maxim Integrated) etc to go into a pairs trade. However, without really analyzing and back-testing relevant data attributed to these pairs, the trading strategy may not achieve its objective.
2) Very poor testing strategy accentuated by complicated models and data snooping. Very often, quantitatively oriented market participants have a tendency to deploy overly parameterized and therefore complicated models. Parameters are added on to just prove a preconceived notion
3) Wrong duration. A certain strategy may work only for a specific time period. Extrapolating those results to a different duration ( or going out of sample) may yield disastrous results.
4) Overly relying on quantitative techniques alone with no consideration of economic fundamentals. There may a good business reason why the pairs move contrary to expectations. However, quantitatively orients investors are loath to make the adjustment
How is Pairs Trading Implemented?
Pairs trading is generally implemented by picking a pair of securities ( don’t want to get too nuanced but really this pair can be several composites and does not have to be limited to 2 securities) to buy (go long) and sell (go short) at the right price, right duration and right ratio within an optimal risk management framework. To identify some of this criteria and relationship, advanced mathematical and statistical techniques are used. But, at its very core is a simple mean-reversion concept of time series.
Let’s assume A is one time series and B is the other time series such that:
A = Ratio (Alpha) * B + White noise or Error term
If A and B make for a good pairs trade, then the expected value of the constant ratio must converge to the mean over a period of time. The mean reversion can be evaluated by testing for co-integration and stationarity of the time series. Remember, it is co-integration and not correlation and it is fairly easy to obscure the two.
Correlation between two time series is in effect a measurement of relation of their returns over a shorter time horizon. In simpler terms, if the stocks are strongly correlated based on daily returns that means that there is a high probability that the stocks move up or down in tandem on most days. However, there is no guarantee that the stock prices will track each other over a longer time period. And over a longer time horizon for the time series, this drift can somewhat be persistent and may never return to the mean (or exhibit any mean reversion). If anyone mistakenly enters into a pairs trade based on a correlation analysis, a rude awakening may be in the offing. It is very natural to jump into a pairs trade on say a (Home Depot, Lowes), (Intel, AMD) or (Pepsi, Coca Cola) without looking at how such a strategy would make make statistical sense for the duration considered. Though some of these stock may exhibit strong daily correlations and make make for good pair trades on a very short term basis, they may end up drifting contrary to expectations in a longer time frame.
Combinations of some time series can exhibit the stationarity property – which means that the drift away from the mean is fairly contained. Though possible, it is very difficult to find individual stocks that exhibit stationarity consistently over longer time periods. There is plenty of academic work that indicates that stocks generally follow a random walk and there is no way to predict future movements based on past movements in a precise and dependable manner. To model individual stock movements, one would have to then rely on stochastic processes (eg: Geometric Brownian Motion GBM) to mimic the randomness inherent in this formula.
“Xt= μ+Xt-1 + ϵt”
Where:
“Xt” is the log of the price of the stock at time t
“Xt-1 ” is the log of the price of the stock at time t-1
“μ” is the drift constant
and “ϵt” is the error or noise term at time tThat said, if you expand your horizon to look for a pair of stocks and depending on what ratio of one you buy versus short (also referred to as the hedge ratio), the overall value of this pair could exhibit stationary or mean reverting properties. Such pairs are then considered to be co-integrated. Remember that this pair portfolio consists of the long and short and the “spread” is the difference in the market prices. The strategy is to simply buy the pair when the spread is low and sell/short the pair when the spread is high with the underpinning premise that the “spread” is mean reverting.
Going back to the time series example from a few paragraphs back:
A = Alpha * B + White noise or Error term
A and B are two time series data sets for two securities. At various points, the ratio Alpha will drift up and below the mean presenting trading opportunities. When Alpha is smaller than the mean, then we buy A and short B. When Alpha is larger than the mean, we do the opposite – short A and buy B.
There are several statistical techniques to mine for this and commonly used test is the Dickey Fuller test ( another one is the Johansen test). Almost all statistical and math software packages (including Matlab, R and Python) offer this functionality. This function is also available open source from the spatial-econometrics toolbox maintained by James P. Lesage with support from the National Science foundation (https://www.spatial-econometrics.com/). I will use the cadf function from this toolbox in the example below. The beauty of the cadf function that it does two things: first it computes the hedge ratio by running a linear regression between the two prices series A and B above to form a portfolio. Then, as a two for one, it also tests for stationarity on the portfolio.
Keep in mind that co-integration properties can exist across multiple time series (not just 2). If you want to test for more than 2 series for cointegration then the Johansen test is probably more apt.
The fundamental premise of the Augmented Dickey Fuller Test is that the change of a certain price series over the next period is proportional to the difference between the mean price and the current price. If you want to read more about the mathematical soups to nuts of ADF, you can refer to the notes here: http://faculty.smu.edu/tfomby/eco6375/BJ%20Notes/ADF%20Notes.pdf
With that basic understanding, let’s analyze two stocks (ADI and MXIM) that display high correlation but are not co-integrated though one can easily be fooled into making that assumption because they operate in the same industry – semiconductors. Here is how the stocks have performed over the past 3 years.
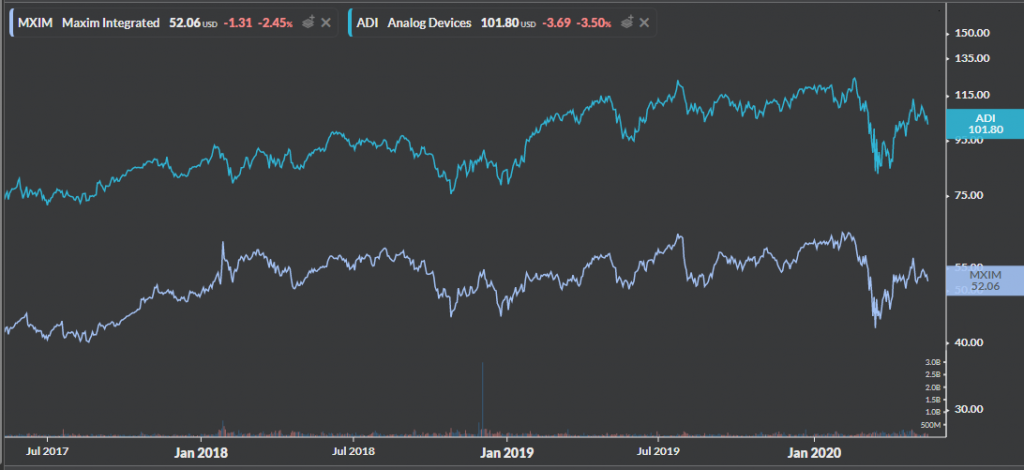
Running a quick lagged correlation coefficient test in Matlab on these two stocks over the past 3 years on daily returns shows a correlation of .8119. With a p-value of 0 this indicates that the two stocks are significantly correlated.
However, the results of the cointegration/augmented Dickey Fuller test indicates the following.
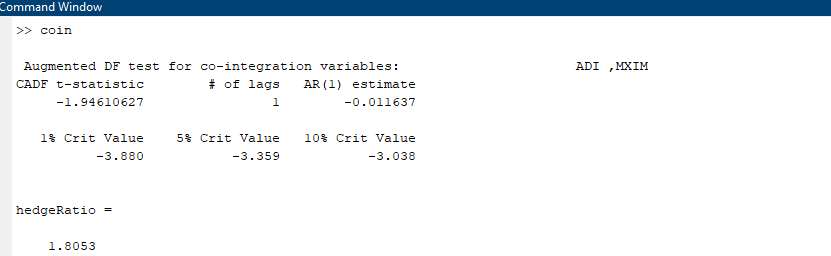
The t-statistic of this test is – 1.9416 which is way lesser than the 90% threshold and we can safely assume that this pair is NOT cointegrated. The hedge ratio is 1.8053 but this does not seem to be a good candidate for pairs trading. Going based on correlation alone would have been the wrong move!
Now, let’s look at two other stocks ( SPY and QCOM) again over the past 3 years and run the same cointegration test.
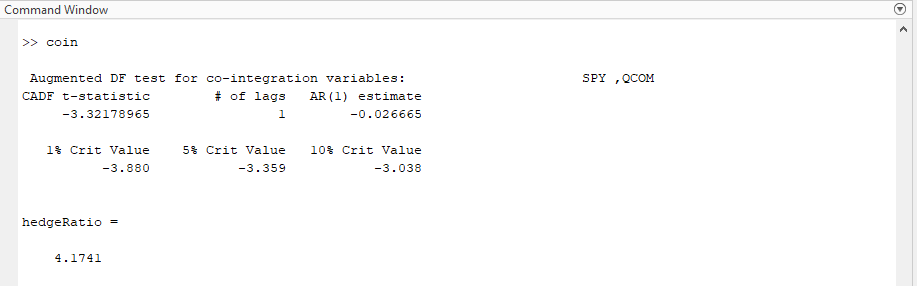
As you can see the t-statistic is a much better -3.3217 which implies a more than 90% probability that the two time series are co-integrated. This would need more validation before putting on the trade at a hedge ratio of 4.174 but definitely seems more promising than the previous pair.
I will not go into generating specific trading signals because that exercise is very nuanced and there are several attributes to consider including training/testing the data set and specific signaling algorithms. However, as a very simplistic illustration, the chart below indicates the z-score based buy and sell signals for the SPY/QCOM pair based on the assumption that the ratio reverts to the mean. The trading signals are generated from a measure of the rolling mean (60 day Moving Average) and (60 day standard deviation). The z score is (5 day moving average – 60 day moving average) divided by (60 day standard deviation). Though this set up looks promising, this needs to be validated further.
All that said, keep in mind that:
1) When regime shifts occur the past data may not absolutely indicate what will happen in the future.
2) If there are obvious pair trading combos, the arbitrageurs will be at work minimizing the marginal utility of the idea.
3) The other basic assumption underlying the algo is that the financial data is normally distributed ( in reality however financial data may not be normally distributed and may exhibit fat tail behavior).
4) Don’t be wed to any strategy and refrain from picking data points to prove a preconceived notion. If testing on in sample and out sample data sets do not provide statistically significant and consistent results, it is probably telling you to not rely on the strategy.
5) There is beauty in simplicity. Keep the model and algorithm as uncomplicated as possible.
Notwithstanding the above, an appreciation of the data and underlying math can help effectively structure your code and increase your odds of success; as long as you don’t throw risk management out of the window.
-
Western Digital – Key Takeaways
Some of you connected to me on LinkedIn may be familiar with a hypothetical portfolio that I am tracking from 2/21. The objective behind that hypothetical portfolio was to encourage investors to step in during the February and March time frame to start building or adding on to positions patiently and with a long term focus. Some of my friends have been ribbing me about a portfolio that has gained 35% or so when there are single stocks that move 40%+ in a week! In response, I often emphasize that this was not meant to be a get rich quick portfolio where you can expect to double or triple your money in short order. Rather, the focus was on constructing a portfolio considerate of risk-adjusted-returns, allowing you to take measured participatory risks and still increase your odds of beating the benchmark (which is the S&P 500).
One of my recent mentions was Western Digital (WDC). I suggested WDC as a possible add on 4/22 (after competitor Seagate (STX) reported earnings). My expectation was a pull-back in WDC in sympathy with STX on 4/23, which played out as I expected allowing a possible entry point in the 39$ area. The stock then surged to the mid 40’s area in the next few days along with the market. My second presumption was a possible pull back after WDC reported earnings on 4/30 mostly due to supply chain disruptions. Though the stock pulled back after earnings, what I was completely blindsided on was the suspension of the dividend. The stock pulled back 10% + the day after earnings, again allowing for a possible entry point in the $39 area. Before going into some key takeaways from the earnings, here is a synopsis of WDC and its key business segments:
Business Summary
Western Digital was founded in 1970 and operates in the data management and storage industry. In terms of the technology underpinning the storage, there is a bifurcation: rotating magnetic technology for hard disk drives (HDD’s) and semiconductor oriented flash memory (used in Solid State Drives or SSD’s). With the advent of the cloud and explosive growth in gaming, personal devices and social media data – individuals and corporates derive immense value in dense data storage. That is, more data needs to be stored and retrieved from a smaller form factor with due consideration on performance, reliability and energy efficiency. The key competitors are Seagate Technology and Toshiba in the HDD market; and Intel, Micron, Samsung and Sk Hynix in the flash market.
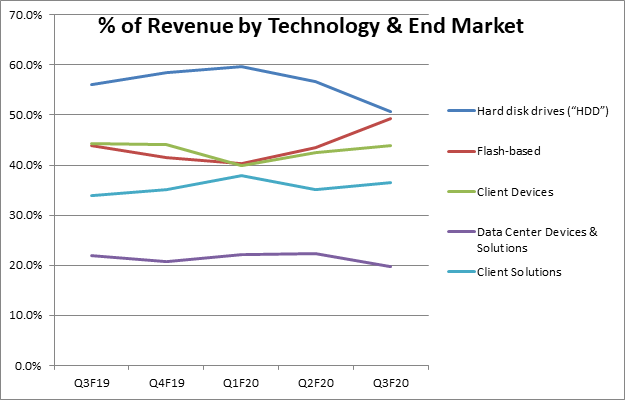
In terms of the reporting segments, there are 3:
1) Client Devices: Includes storage (both HDD and SDD based) for desktops, laptops, gaming consoles, security surveillance systems. The flash based devices also span smartphones, edge computing devices, wearables, Internet of Things, connected home and memory wafers/components. This segment also includes the embedded products like the multi-chip package solutions combining flash (non-volatile memory) and DRAM (volatile memory) in one package.
2) Data Center Devices and Solutions: This segment includes HDD’s and enterprise class SDD’s geared towards the fast growing data center market. Scalability of storage, performance, cost and reliability are key aspects of the solutions here.
3) Client Solutions: This segment includes HDDs and SSD’s included in removable devices (cards, USB drives and wireless drives). A lot of the increase in digital storage from a consumer perspective has a direct impact on this segment
Below are some key charts across the reporting segments and technologies.
Takeaways
Here are some key takeaways from the earnings:
- Overall Strategy: With the new CEO, what in hindsight should have been fairly apparent was a possibility of recalibration in terms of how to position the company for the future and capitalize on strengths while maintaining fiscal discipline. More specifically, given the cyclical nature of the business there seems to be absolute focus on deleveraging and cash flow.
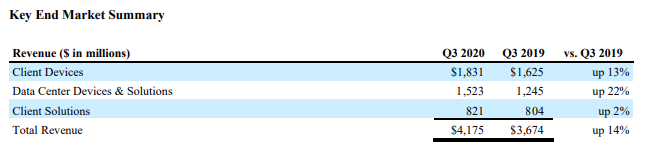
- Net revenue of $4.2B down 1% sequentially and up 14% from the prior year period.
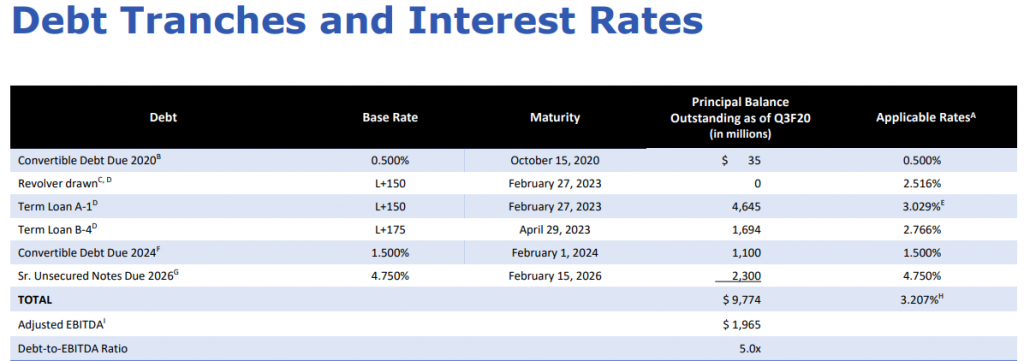
- The goal is to manage leverage from 1 to 3.5 times EBITDA through the business cycle with the third quarter debt to EBITDA reading closer to 5 (which btw was 5.7 earlier). Suspending the dividend gets them closer to that target ratio but management has made it clear that, as things stand, there is plenty of wiggle room to meet debt covenants. So this move should not raise any red flags there. Just for background, much of the debt on the balance sheet can be attributed to Western Digital’s $19B acquisition of SanDisk in 2015. Gross debt outstanding at the end of the third quarter was $9.8B. The goal is to get the gross debt down to $6B and net debt down to $3B.
Here are the debt tranches and Interest Rates:
- WDC management is in my opinion doing the right thing by focusing on providing visibility on a next quarter basis. These are unprecedented times and it makes sense that they are not able to provide visibility beyond the next quarter
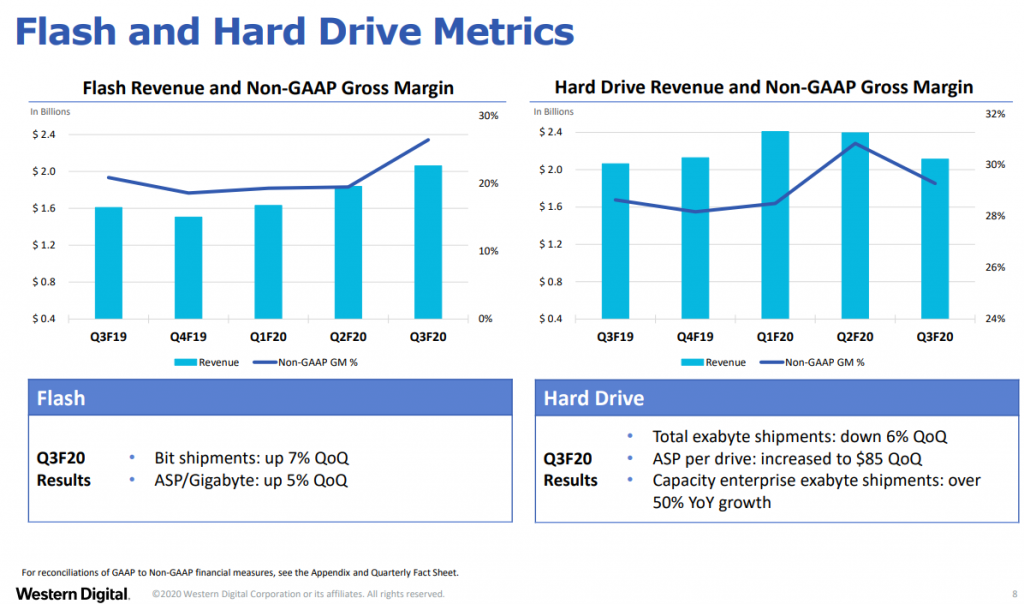
- There is somewhat of an offsetting effect on two sides of the business. Flash and Hard Drives. Gross Margins from the flash side of the business should increase (prices trending higher but fairly volatile) while there is bound to be near term pressure in the Hard Drives side of the business. WDC would rather focus on the Enterprise SSD side of the business to channel the good demand in the data center arena.
- Public cloud is a generational technology shift and WDC wants to position itself for the enterprise hard drive market. Expect R&D spend to drive further innovation here. Similarly, on the flash side WDC wants to position to take advantage of the progress on the edge computing side and the increasing demands for more memory intensive use cases on the edge devices
- The 18TB energy assisted drive ramp is happening on ramp and there seems to be initial indication of the data center demand but this is going to really be a multi quarter story and will take time. Some indications of market share loss in the 16TB area.
- Inventory across the board seems to be at equilibrium but there may be more of a drawdown next quarter due to supply chain challenges specific to COIVD-19.
- On the technology side, WDC seems to be making good progress with the development on internal controllers and sidestepping reliance on third party vendors. There were some promising developments as highlighted in the internal product blog here: https://blog.westerndigital.com/vertical-integration-asic-platform-defines-future-products/
- In terms of the guide, Q4 revenue is expected to be in the range of $4,25B to $4.45B with non-GAAP EPS of $1 to $1.4.
Summary
- · Though we believe in prospects for WDC in the long term, the dividend suspension will now attract a different kind of investor. This may reflect in a higher beta overall on the stock and the stock maybe more susceptible to downdrafts if the overall market moves down.
- · Some of the enterprise hard drive demand story needs to be validated over the next few quarters – especially the demand side of the 18TB drive with enterprise OEM’s and hyper scale customers
- · The guide was kind of disappointing but there may be some conservatism in the numbers
- · Deleveraging is an understandable step and free cash flow discipline needs to be applauded. On the technology side, will be keen to see R&D deployed strategically to make sure that WDC keeps innovating on the areal density side
- · Watch for smartphone market improvement to see how this reflects in the flash based numbers later in the year
Our FV estimate on WDC is $54. Please contact us for the underlying FV model.
Important: This is not meant to be specific investment advice. Always check with your Financial Advisor for suitability of any investment.
-
Decoding the Network- Advances & Investment Options
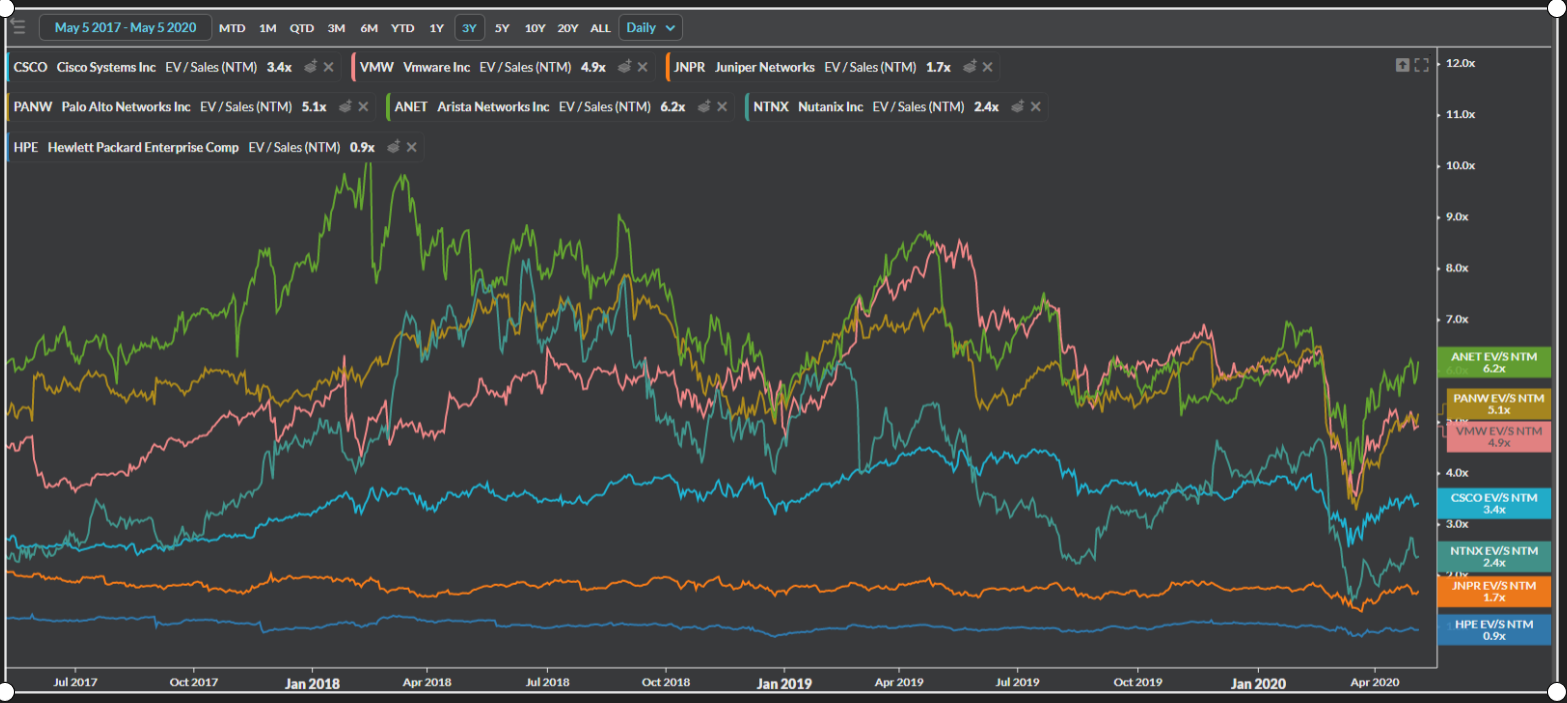
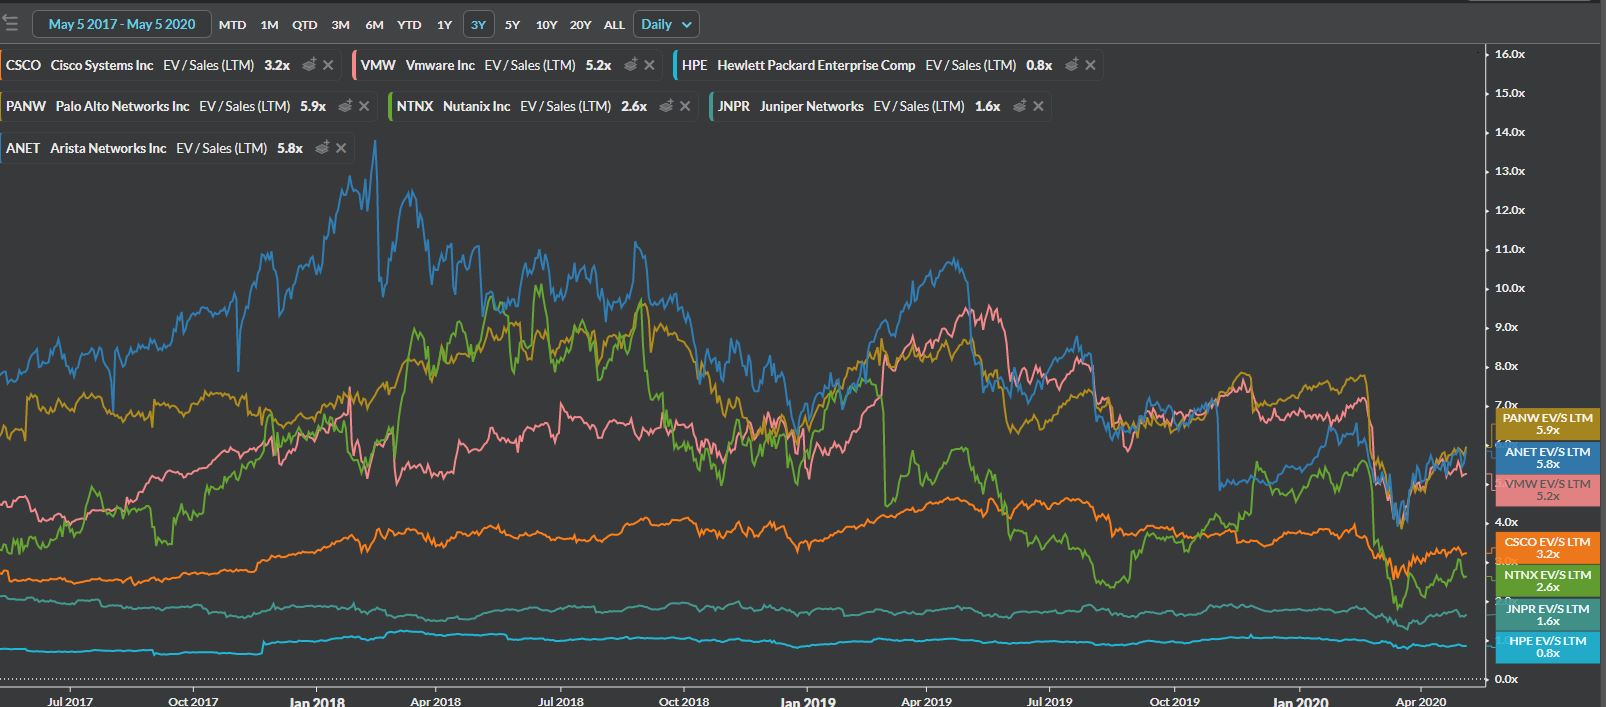
EV/SALES (NTM) - Select Networking Stocks 
EV/SALES (LTM) - Select Networking Stocks We live in an increasingly interconnected world and advances in networking keep pushing the envelope of applications geared to both enterprises and consumers. To put some of this in numeric terms:
- By 2023, there will be 5.3 billion Internet users (66% of global population), up from 3.9 billion in 2018 (51% of global population)
- By 2023, there will be 5.6 billion total mobile users (70% of global population), up from 4.9 billion (65% of global population) in 2018. The number of devices connected to IP networks will be more than three times the global population by 2023.
- By 2023, there will be 29.3 billion global devices and connections (3.6 devices and connections per capita), up from 18.4 billion devices and connections in 2018 (2.4 devices and connections per capita)
- By 2023, 45% of all networked devices will be mobile connected globally and 55% will be wired or connected over Wi-Fi.
- By 2023, nearly 11% of the global mobile connections will have 5G connectivity
- By 2023, the average global fixed broadband speed will be 110.4 Mbps, up from 45.9 Mbps in 2018, a 2.4-fold growth.
- By 2023, the average global Wi-Fi speed will be 91.5 Mbps, up from 30.3 Mbps in 2018, a 3- fold growth.
- By 2023, the average global mobile (cellular) speed will be 43.9 Mbps, up from 13.2 Mbps in 2018, a 3.3-fold growth.
- By 2023, globally, 5G speeds will reach 574.6 Mbps and will be 13 times faster than the average mobile connection
- By 2023, there will be 299.1 billion global mobile application downloads, up from 194 billion global mobile application downloads in 2018
“Source: Cisco Annual Internet Report, 2018 – 2023”
In the context of these advances, several networking related terms have been bandied about by the investment community; often interchangeably, sans an appreciation of the actual technical nuances underpinning the terminology. This alphabet soup includes SDN, NFV, IBN and SD-WAN. Without an understanding of what these mean (at least at a high level), investors may be flying blind in terms of the best investment opportunities, necessitating an over reliance on analyst ratings and financial metrics alone. On the other hand, just because a firm has bleeding edge technology does not automatically translate to a good investment opportunity. So what do these terms mean and what are some investment options that provide a basis for participation in some of these trends? Lets tackle each one in order.
Software Defined Networks (SDN)
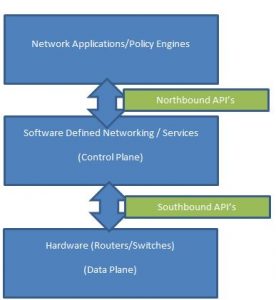
Software Defined Networking (SDN) as a concept is not new and traces its roots back to the ForCES (Forwarding and Control Element Separation) protocol and the Ethane protocol, which then was elegantly funneled in the Open Flow protocol(2008). At the core of all these protocols was a fundamental decoupling of the hardware and control mechanics ( via software components). These efforts and some laudable championing by the Open Network Foundation paved the way for Software Defined Networking to flourish with some start-ups in the earlier part of the decade drawing some serious investor interest (Nicira, Big Switch Networks, Contrail and Vyatta to name a few). At the core of the SDN architecture is also the separation of the “control” plane from the “data” plane –what this largely denotes in simpler terms is that the software does more and the hardware does relatively less. Several incumbent hardware vendors like Cisco, Juniper and their ilk realized that a business strategy pivot was needed in terms of financial dependence on just the hardware side of the business that presented the risk of being a commoditized over time. Abstracting a lot of the erstwhile hardware functions into the software or control plane allows for more automated provisioning and policy oriented management of network resources. This also opens up the possibility of more deliberate integration with a plethora of cloud orchestration platforms. Managing remote sites by calibrated distribution and centralized control of compute capability, facilitating edge computing by optimal allocation of resources to reduce latency and thereby laying the ground for a more efficient IOT (Internet of Things) infrastructure are all possible with a properly configured SDN environment. SDN could also potentially improve the security posture of the network via segmentation – allowing different network segments to have different security settings depending on the sensitivity of the assets attributed to each segment. There is certain intelligence to how the network is managed. Just imagine a situation where you are part of a corporate video call and there is quality degradation due to network congestion. The intelligent software defined network could allow the bitrates to increase and can automatically avail of the highest bandwidth available and make that adjustment before any of the meeting participants are subjected to the lowered bit rate or quality degradation. In effect, the intelligent network is figuring out the best path for each packet factoring in several complex data points.
The diagram below depicts the standard SDN Architecture:
What to watch for?
Cisco has been at the forefront of this along with Juniper and VMWare and of late firms like HPE have made tremendous progress in terms of incorporating SDN as part of their hybrid cloud strategy. VMware was one of the pioneers of this movement and keeps giving Cisco stiff completion with the NSX and VeloCloud products.
Though it is hard to say in pure terms who will be at a disadvantage due to this phenomenon, one could make the argument that the physical footprint overall will be leaner. As such, for data center REITs and hardware vendors who do not make the pivot to a software oriented approach, this could be considered a net negative.
Network Function Virtualization (NFV)
Network Function Virtualization started as an effort by a telecommunication vendor consortium (ETSI Industry Specification Group) with the primary objective of simplifying end consumer offerings and provide for flexibility in managing the networks. The network functions are then placed on the virtualized network and off of commodity hardware, thereby reducing costs significantly including network operator opex as well as reduced power consumption. NFV provides a solid framework for the advent of 5G but there needs to further work done around the horizontal integration around the NFVI ( NFV Infrastructure) and how to containerize and enable more advanced edge computing. The NFV market is expected to grow from ~13B in 2091 to 36B in 2024, at a CAGR of 22.9%.
What to watch for?
The major players are: Cisco, Ericsson, Huawei, VMware and Nokia. HPE, Juniper Networks, Dell, Affirmed Networks and Netscout round up the next tier. Against the backdrop of security concerns and a lack of fundamental trust in utilizing cross-border technology (for now centered on Huawei), the work done by the O-RAN alliance (Open Radio Access Network) and the applications emanating from this technology become critical to monitor. The Nordic vendors (Ericsson and Nokia) may benefit at Huawei’s expense if this plays out in a larger context. Their balance sheets are not pristine but if they play their cards right, this could be a huge long term opportunity to gain some market share. In the RAN space, developments from smaller US vendors like Mavenir and Parallel Wireless are also worth following.
Intent Based Networking (IBN)
Intent Based Networking expands on the Software Defined Networking concept by viewing the intelligent network from a business use case perspective. For a business facing unit manager, irrespective of what the underlying technology “is”, what really matters is what the technology “does” for the user. If the bleeding edge network technology does not translate to a tangible business benefit for the user, then it loses its efficacy. This translation of intent from business to technology is one of the key pillars of IBN. As an example, for the finance function at an enterprise during the end of quarter or end of fiscal year cycle, the network needs to be intelligent enough to translate key business needs to a prioritized handling of network functions for the finance business unit so that there is no dip in service quality. The second pillar of IBN where there are parallels to SDN is the concept of activation/automation. The network and security policies are automatically created and applied to the network with a focus on optimization, security and reliability. The additive part is that techniques like Machine Learning and Artificial Intelligence are applied on the automation track to traverse through complicated scenarios and apply an outcome based approach to automation. Much of this relies on an awareness of the network formed by analyzing several historical data points ( learning) and then using that context to activate based on what is being observed closer to real time. The third pillar of IBN is assurance. Here again, ML and AI have a role to play to ensure that there is proactive monitoring and management of network resources to make sure that there is no dip in SLA’s. Also in play is a continuous feedback look to short circuit learning opportunities. In short IBN is an extension of the SDN paradigm to apply mathematical models/AI/ML to network management and orchestration. Interestingly enough, IBN can be applied on SDN and non-SDN architectures.
What to watch for?
Cisco is doing all it can to make sure it does not lose it enterprise IBN pole position with an additional overlay of “coherent” technology. Yes, yet another buzzword! Coherent technology allows for optical signals to send across long distances. With Cisco’s $2.6B acquisition of Acacia Communications, it has clearly signaled that optics play a key part from a pluggable standpoint in terms of increasing networking capacity and reduce complexity and costs. Cisco also recently bought Exablaze, a very interesting firm that has a FPGA based technology to reduce network latency. Two smaller private firms that I find really worth following are: Apstra Networks ( pioneering intent based analytics and some cool features in their latest product release) and Forward Networks ( utilizing a unique mathematical model for network verification). The other key vendors are Juniper Networks, Huawei, Indeni, Avi Networks and Gluware.
Software Defined Wide Area Network (SD-WAN)
SD-WAN is the next stage in the evolution of Wide Area Networks. The biggest shift in trajectory over the past 20 years has been the shift in enterprise application usage from a client server centric and largely on premise or data center oriented approach to a hybrid approach that encompasses SAAS applications and both the private/public clouds. As such, along cost and operational efficiency dimensions, it makes sense to not just look at let’s say an MPLS oriented infrastructure solution but also evaluate how to leverage broadband/4G/5G oriented solutions utilizing edge device capabilities. The MPLS approach is reliable but in terms of costs per bandwidth as well as set up time it is less than ideal in the present landscape. In short, the Software defined WAN approach allows an aggregation of a wide swath of network connections into an edge device at a branch location and has the intelligence to prioritize network traffic with active measurement and consideration of latency, jitter etc. Setting up the SD-WAN also allows for a ramp up to using cloud gateways sitting in the public cloud and avoiding “backhauling” (Backhauling referring to the direction of traffic first to the DC and then to the SAAS applications). The edge device under the SD-WAN aegis can utilize a secure tunnel and access the SAAS cloud apps with better visibility, performance due to the reduced hops. In terms of utility and adoption, SD-WAN owing to a crystal clear ROI discussion between the CIO/CFO is rightfully the technological evolution that is not just pie in the sky but is getting adoption right now, right here. According to IDC, 40 percent of global IT leaders surveyed say they’ve currently deployed SD-WAN; nearly 55 percent more expect to deploy within 24 months. Cisco for instance has numbers out that indicate that 70% of the Fortune 100 are using some form of Cisco’s SD-WAN solution (across its Meraki and Viptela products). With the understanding of the mechanics in play as articulated above it should become clear that the whole SD-WAN phenomenon becomes a second derivative play on enterprise cloud adoption.
What to watch for?
An emerging trend is a focus on an all in SD-WAN solution inclusive of Security. Fortinet, SonicWall, Barracuda are some firms at the forefront of this. Cisco (buying Duo) and VMWare( buying Nyasa) have made intentions clear in terms of their all-in SD-WAN strategy. Palo Alta Networks has also thrown its hat in the ring with the $420M acquisition of CloudGenix with the intent of integration with its Prisma product. In Cisco’s case, it will be interesting to see how this integration plays out relative to the Umbrella security suite and how Duo can help it achieve true zero trust security. The one additional consideration is the need for purpose built ASIC (Application Specific Integrated Circuits) in the realm of the encrypted tunnels (from the edge devices) mentioned above because IPSec based encryption can be a memory and processor hog. Also on the horizon would hopefully be a secure envelope to the containerized world (Kubernetes etc). Juniper Networks through its HTbase acquisition ( giving it the Juke container product) has been making some headway ( including a contract with IBM) in terms of integrating with their core Contrail product. In terms of market share leadership specific to the SD-WAN, VMWare, Cisco, Aryaka, Fortinet and SilverPeak typically round out the top 5 with Fortinet making some impressive progress over 2019.
Cisco AcquisitionsHow Cisco is positioning for new age network leadership via strategic acquisitions. Based on our analysis, these are the acquisitions over the past decade that play into Cisco's positioning in the SDN/IBN/SD-WAN/HCI realm.Acquired Company Acquired Date Deal Value Integrated Under Product/Unit Strategy Notes Core Optics 5/3/2010 Cisco 8000 series Optical Data Center Interconnect LineSider Technologies 12/1/2010 Cisco Overdrive Network Hypervisor Network Management Lightwire Inc 2/1/2012 $271M Cisco 8000 series Optical Data Center Interconnect Meraki Inc 11/1/2012 $1200M Cisco DNA Software Defined Network Cariden Technologies 11/1/2012 $141M Cisco Service Provider Telecom services and network management, Optical convergence Intucell 1/1/2013 $475M Telecom Services Self optimizing network softwarenfor carriers Cognitive Security 1/1/2013 Cisco DNA Advanced network threat detection SourceFire 7/1/2013 $2700M Security Portfolio Advanced cyberthreat monitoring solutions Threatgrid 5/1/2014 Security Portfolio Dynamic malware analysis Tail-f systems 6/1/2014 $175M Evolved Services Platform Network Service orchestration solutions (SDN/NFV) Metacloud 9/1/2014 Open Stack as a Platform/Intercloud Architecture Memoir systems 9/1/2014 IP used in several products ASIC Embrane 4/1/2015 Application Centric Infrastructure (ACI), Nexus LCM for ACI, SDN Piston Cloud Computing 6/1/2015 Intercloud OpenDNS 6/1/2015 $635M Cisco Umbrella Advanced threat detection Parstream 10/1/2015 SD-WAN Data Analytics for IOT Lancope 10/1/2015 $452M Cisco Umbrella/Security Everywhere Advanced threat detection Jasper Technologies 2/1/2016 $1400M Cisco IOT IOT Connect CliQr Technologies 3/1/2016 $260M ACI, UCS LCM for Cloud Orchestration Leaba Semiconductor 3/16/2020 $320M IP, ASIC Advanced Chip Technology CloudLock Inc 6/1/2016 $293M Cisco Umbrella/Security Everywhere Cloud Access Security Broker ContainerX 8/1/2016 Cloud Platform and Technology Container Management Technology AppDynamics 1/17/2020 $3700M IOT SDN, IBN, IOT Viptela 5/1/2017 $610M Cisco DNA SD-WAN Observable Networks 7/1/2017 Security Everywhere Cloud Security Springpath 8/1/2017 Hyperflex Hyperconverged Data Platform,SDN Perspica Inc 10/1/2017 AppDynamics ML, IBN Cpmute.Io 12/1/2017 CloudCenter SDN,IBN Skyport Systems 1/1/2018 IP across products, Security Everywhere Hyper converged Infrastructure and Security Duo Security 8/1/2018 $2350M Cisco Umbrella, Security Everywhere Zero Trust security Ensoft 11/1/2018 Service Provider Networking Network Service provider solutions Luxtera 12/1/2018 $660M IP across products, IBN portfolio IBN, Photonics Singularity Networks 1/1/2019 Crosswork Network Automation Networks Analytics platform, IBN Sentry 6/1/2019 IOT IBN, IOT Security Acacia Communications 7/1/2019 $2600M IBN portfolio Coherent optics technology, IBN Exablaze 12/1/2019 Complement Nexus portfolio Ulta low latency FPGA technology FluidMesh 4/1/2020 IOT Industrial Wireless backhaul solutions VMWare AcquisitionsVMWare which is majority owned by Dell has assembled an impressive portfolio of assets as well. This may somewhat be a hedge against any disruption to the server virtualization business posed by the likes of Kubernetes.Acquired Company Acquired Date Deal Value Integrated Under Product/Unit Strategy Notes PacketMotion 8/1/2011 VMWare vCloud Networking and Security User activity context for data access monitoring and network segmentation, including PacketSentry Virtual Probe, which monitors and enforces identity based network access controls in VMware vSphere as well as rich user access monitoring reports for compliance. CloudCoreo 2/1/2018 VMWare Secure State Multi-Cloud Security Heptio 11/18/2020 Not clear yet Container Ecosystem - Kubernetes Bitnami 5/1/2019 Not clear yet Cloud/Container ecosystem support Avi Networks 6/1/2019 VMware NSX Advanced Load Balancer Complete software-defined networking stack from L2-7 built for the modern multi-cloud era. Software load balancer, web application firewall (WAF), analytics and monitoring, and a universal service mesh. Uhana 7/1/2019 VMWare Telco Cloud and Edge Cloud Deep learning to optimize carrier network operations Veriflow 8/1/2019 vRealize Network Insight Network Monitoring and Diagnosis CarbonBlack 10/1/2019 $2100M Not clear yet Advanced threat detection and network monitoring Pivotal Software 12/1/2019 $2700M Not clear yet Cloud/Container ecosystem support Nyansa 1/1/2020 Intent Based Networking, AI based network analytics, SD-WAN In Summary, across all the above themes, the one company that stands out is Cisco (CSCO). If you are looking strategically for an investment thesis to ride all these trends with relatively minimal earnings volatility, Cisco is that one option. As you move higher up the risk spectrum ( including both public and private firms), there are other options like VMWare, Juniper, Palo Alto Networks, HPE, Arista Networks, Dell, Ericsson, Nokia, A10 Networks, Apstra, Forward Networks, Gluware, Avi Networks, Indeni, Veriflow and Intentionet. Please reach out to me at Krishna@olivineresearch.com for detailed models and investment thesis surrounding these names including a Sum of the Parts Analysis of Cisco Systems.
Pairs Trading: The Math behind the Code
However, the results of the cointegration/augmented Dickey Fuller test indicates the following.
The t-statistic of this test is – 1.9416 which is way lesser than the 90% threshold and we can safely assume that this pair is NOT cointegrated. The hedge ratio is 1.8053 but this does not seem to be a good candidate for pairs trading. Going based on correlation alone would have been the wrong move!
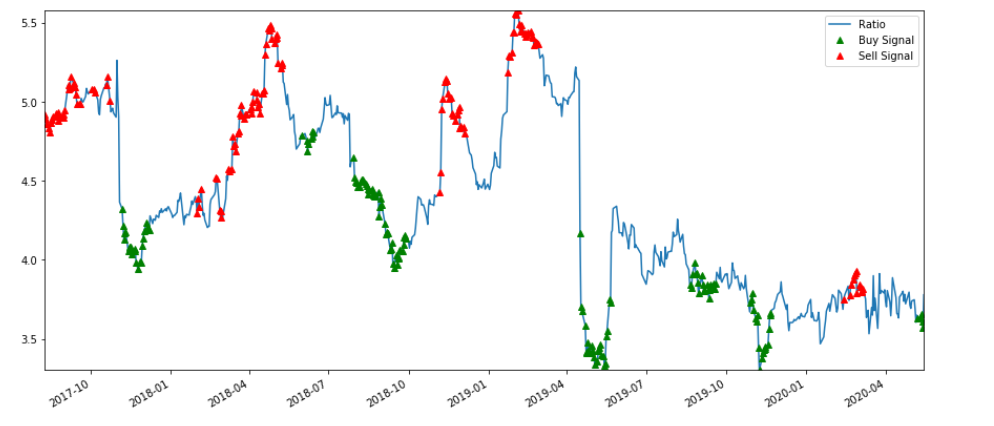
Now, let’s look at two other stocks ( SPY and QCOM) again over the past 3 years and run the same cointegration test.
As you can see the t-statistic is a much better -3.3217 which implies a more than 90% probability that the two time series are co-integrated. This would need more validation before putting on the trade at a hedge ratio of 4.174 but definitely seems more promising than the previous pair.
I will not go into generating specific trading signals because that exercise is very nuanced and there are several attributes to consider including training/testing the data set and specific signaling algorithms. However, as a very simplistic illustration, the chart below indicates the z-score based buy and sell signals for the SPY/QCOM pair based on the assumption that the ratio reverts to the mean. The trading signals are generated from a measure of the rolling mean (60 day Moving Average) and (60 day standard deviation). The z score is (5 day moving average – 60 day moving average) divided by (60 day standard deviation). Though this set up looks promising, this needs to be validated further.